Bitcoin vs. Ethereum: historical data predicts expanding gap in H2
Quick Take
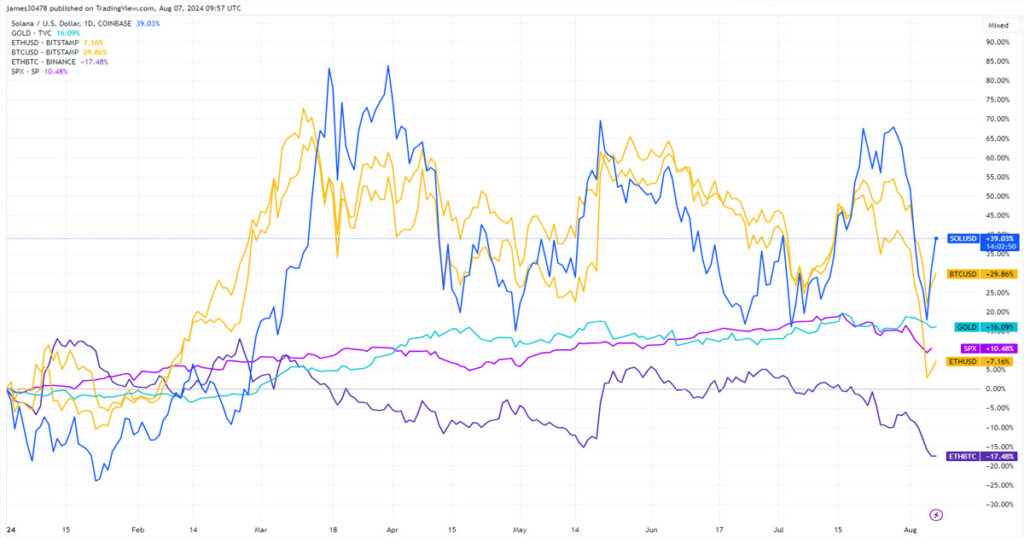
Bitcoin remains the benchmark for global assets performance, boasting an impressive compound annual growth rate (CAGR) of 63%. Despite a recent price drawdown, it remains one of the best-performing assets in 2024, up around 30%. In contrast, Ethereum faces the challenge of outperforming Bitcoin. The recent launch of an Ethereum ETF resulted in over $2.2 billion worth of outflows from Grayscale’s ETHE, creating short-term price headwinds. However, consecutive inflows on the past two trading days suggest this phase has passed.
Year-to-date, Ethereum has only risen by 8%, lagging behind gold (up 16%) and the S&P 500 (up 11%). The ETH/BTC ratio has declined by 17% this year, currently at just 0.043. Meanwhile, Solana has surged 40% YTD, further outpacing Ethereum in 2024.
BTCUSD, SOLUSD, Gold, ETHUSD, SPX, ETHBTC YTD: (Source: TradingView)
Examining historical performance using Coinglass data, splitting Ethereum’s returns into H1 and H2. The first half (H1) averages an 18.08% return, while the second half (H2) averages just 3.61%. Bitcoin’s historical data shows an H1 return of approximately 8.83% and an H2 return of 13.24%. This trend suggests that the performance gap between Bitcoin and Ethereum will likely widen based on historical patterns.
The post Bitcoin vs. Ethereum: historical data predicts expanding gap in H2 appeared first on CryptoSlate.
Quick Take Bitcoin remains the benchmark for global assets performance, boasting an impressive compound annual growth rate (CAGR) of 63%. Despite a recent price drawdown, it remains one of the best-performing assets in 2024, up around 30%. In contrast, Ethereum faces the challenge of outperforming Bitcoin. The recent launch of an Ethereum ETF resulted in
The post Bitcoin vs. Ethereum: historical data predicts expanding gap in H2 appeared first on CryptoSlate.